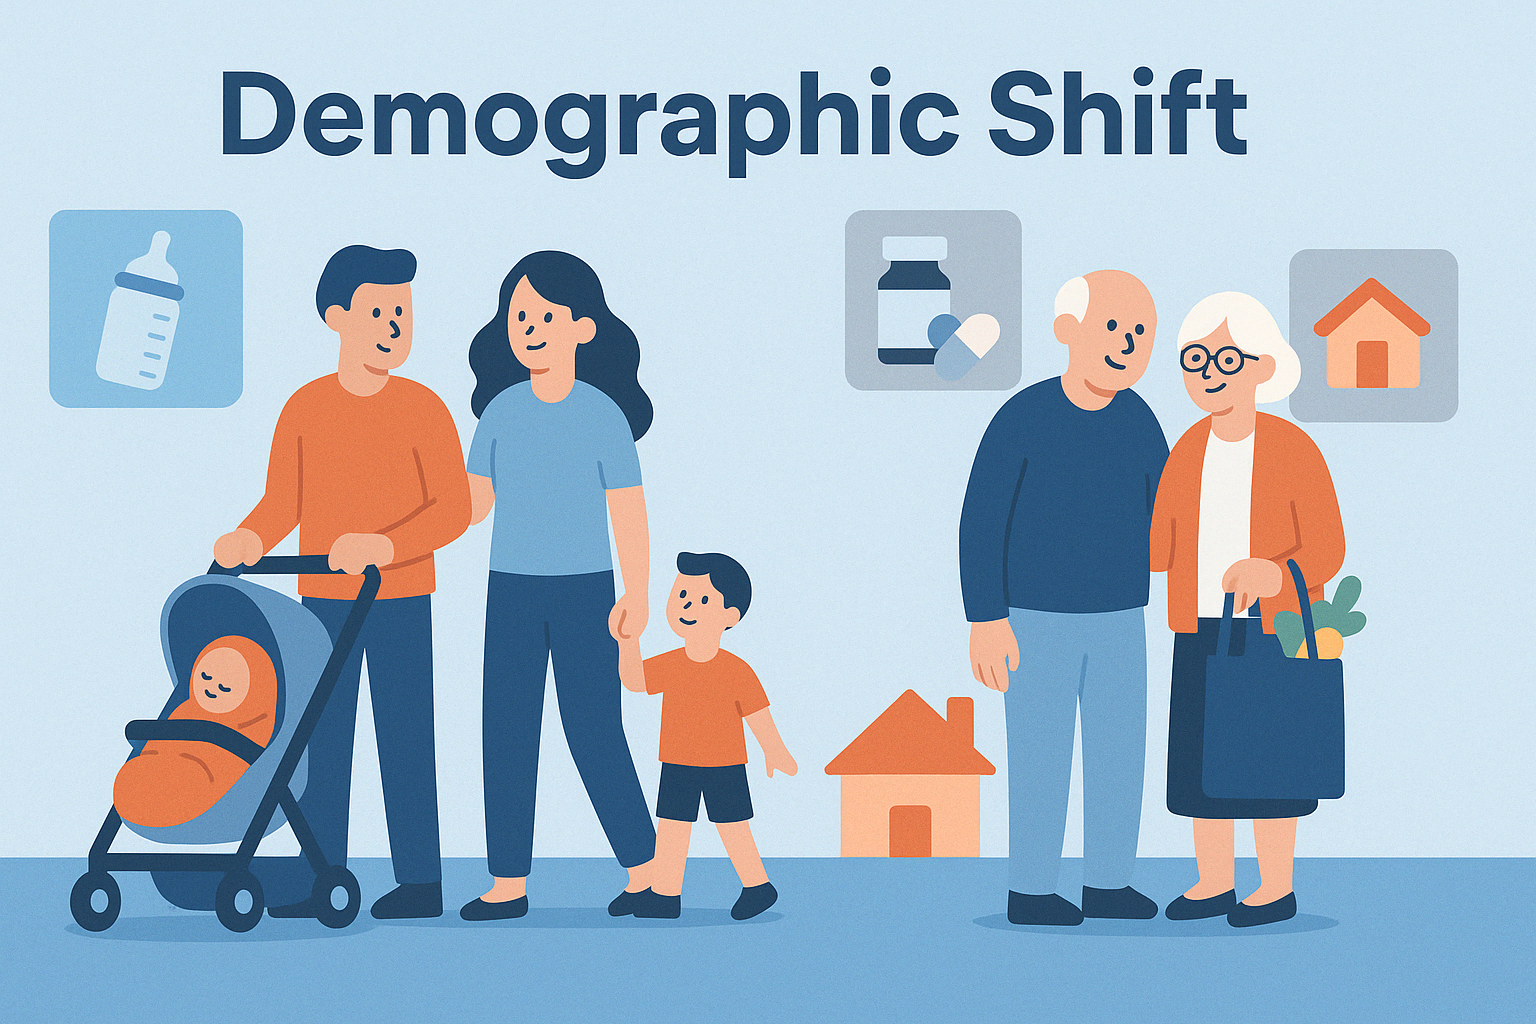
Demographic Shift and Their Consumption Implications for 2030
Global demographic structures are shifting rapidly. Fertility rates are declining, populations are aging, and the composition of households is transforming. This is not just a phenomenon in developed countries — Latin America, Asia, and parts of Africa are also experiencing these changes, although at different speeds. The implications for consumer behavior, retail dynamics, and category relevance are enormous.
Why is this important?
Demographics are destiny in consumer markets. Shifts in age composition and household types alter:
- The size and growth rate of entire categories (e.g., infant formula vs. joint supplements)
- Shopping habits (e.g., frequency of visits, average basket size)
- Product and packaging needs (e.g., family packs vs. single-serve)
- Communication style and preferred channels
"An aging population is not just a healthcare issue — it is a consumption revolution."
― Retail Academy
How This Can Shape Business Decisions
Understanding demographic shifts allows businesses to:
- Forecast which categories may shrink or grow
- Adapt their product portfolio toward emerging needs
- Invest in the right regions based on urbanization and aging trends
- Develop shopper journeys that reflect evolving household roles
Key Data Sources & Variables
| Data Source | What to Track |
|---|---|
| Population projections (UN, World Bank, National Institutes) | Share of population in key age groups: 0–14, 15–49, 50+, 65+ |
| Household composition statistics | Trends in 1-person households, multigenerational homes, couples without children |
| Retail panel data (Nielsen, Kantar, GfK) | Penetration, frequency, spend per trip by age or family structure |
| Consumer surveys / ethnographic studies | Needs, barriers, attitudes toward aging, independence, health |
How to Analyze This Shift Using Data
To analyze the impact of demographic change, start by segmenting penetration and frequency by age group. For example, compare the behavior of households aged 25–34 vs. those aged 55–64 for a given category. Do older households buy less often? Do they shift to different brands or formats?
Use basket analysis to understand the composition of purchases by life stage. Are seniors buying more ready-to-eat meals? Are single-person homes prioritizing shelf-stable convenience products?
Then project forward: take population forecasts by country or city and simulate category growth under future demographic distributions. For instance, if households with children will drop 15% by 2030, how does that affect breakfast cereal, baby wipes, or juice boxes?
"Data doesn't just describe the present — it lets you test the future before it arrives."
― Retail Academy
Combine macro (population projections), meso (household structure), and micro (shopper behavior) to identify categories at risk — and those poised for growth. This isn't just strategy, it's survival in a maturing consumer landscape.

